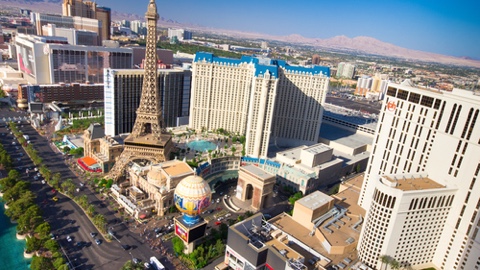
The City of Las Vegas attracts 40 million visitors, annually, and takes mobility of its visitors and citizens very seriously. Hear more about how they integrate vehicles, pedestrians, and cyclists and collect meaningful data:
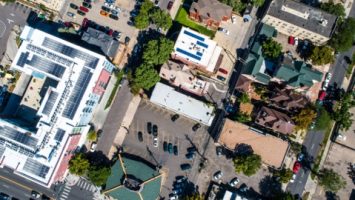
In a traditional sense, city streets are the exclusive domain of motor vehicles, but the reality is that pedestrians and cyclists are in the mix, and their safety needs to be assured. In the past, the only way to get a true sense of how vehicles, pedestrians and cyclists interact was to post people in an area to conduct counts over a long period of time. Video technology and the emerging field of video analytics have removed that burden to enable real-time collection and presentation of metrics related to the movements of vehicles, pedestrians and cyclists. The City of Las Vegas and its technology partner have installed “smart cam” at intersections in the downtown Innovation District to collect data in real-time 24/7. This data is analyzed and visualized to suit the needs of different stakeholders. Video analytics ingests and analyzes the raw data so that it may be displayed in a readable format and provide valuable insights, not only for public safety, but also for businesses looking to invest in area. In addition, bicycle-counting and parking space analysis can improve transit efficiency which is imperative for a city attracting 40 million annual visitors. Leveraging data in a practical and understandable way allows all stakeholders to make more objective decisions, implement operational efficiencies, increase citizen engagement and deliver services.
Q: What does the term ‘smart city’ mean to you, and how does your project contribute to a larger smart city vision?
A: A “smart city” uses technological and social solutions in an innovative ways on the domains of public safety, economic growth, education, mobility, equity and people. Such a city addresses the challenges posed by these domains in ways that are economically, socially, and environmentally sustainable. Embracing the smart city principles, the City of Las Vegas has opportunities to solve widespread problems, to amplify its strengths, and to attract capital and talent. This particular project has had a positive impact on the city’s planning and operations by accelerating staff’s understanding of how people actually behave when navigating city streets, either in a vehicle, on a bicycle or on foot. The introduction of cutting edge video cameras combined with computer-aided analysis of the video feed displayed in real-time on a dashboard depicting metrics of importance to decision makers is the epitome of being smart. With this project, the city has a “single pane of glass” enabling city officials to act based on accurate, timely information.
Q: Why is the implementation of your project transformational in our current society?
A: Citizens in our hyper-connected society are used to receiving accurate information they depend on immediately. Their expectation extends to city government in that they trust it to have important information it depends on just as quickly. People make decisions throughout their day based on information curated from multiple sources. City staff do the same, but they actually have a hand in deciding what is important data to collect, how to collect it, and how to vet it so that it is trustworthy. This project, which collects and analyzes data about the behavior of people driving vehicles, riding bicycles and walking, provides city officials an aggregated view of how they all interact with each other and with city assets such as traffic signals and signs/markings. And this data is collected and analyzed over time to provide city officials with trends that can possibly be used as predictors of behavior. This insight becomes part of the city’s planning, design and operations aimed towards making the city streets as safe as possible.
Q: What advice did you receive along the way that helped you complete your winning project?
A: A key piece of advice was that technology, big data and GIS can inform, but they still must be infused with reality. In the past, planners mapped building conditions, uses, etc. block by block, combining the data for each block because that was the simplest way to summarize it. They combined data for each side of the street with data from the other three sides of the block, ignoring the street. This resulted in a graphic depiction of an area, but it promoted the image of streets as dividers rather than as unifiers. With advances in technology, such as the introduction of video analytics to provide a true picture of what is occurring on the street itself, planners are able to alter that mindset so that streets become as important as the block. That mindset will result in better designs for safer streets.
Q: What advice would you give a city community or a solution provider looking to implement a municipal-level project?
A: Every city wants to be a safe city that employs data analytics to inform planners, designers, officials and field staff. We have come to expect that digital technology connects people; and that the Internet of Things connects everything so that every single thing can be identified and geo-localized; and that we need real-time data collection and analytics to maintain situational awareness. Pressure is on us to identify challenges (e.g. pedestrian safety) then seek solutions that address public concerns using a combination of digital and social innovation. Technology and analytic techniques are important components of strategic alignment to improve government operating efficiencies and service delivery. But neither one of these are strategies, nor are they sufficient alone for effective leadership. They are just tools and one subsystem of the complex dynamics and inter-dependencies of a smart city.
Q: What does it mean to you to win the Smart 50 Awards?
A: It is an honor having the Smart Cities Connect organization and its partners recognize what is the culmination over a tremendous amount of work by a large team of people all focused on a single outcome…to make City of Las Vegas streets some of the safest in the nation.