
Guest author Bryan Darr, EVP, Smart Cities at Ookla
As events are cancelled and facilities are shut down across the country, the importance of home broadband access has suddenly taken on a new urgency. The closing of our public and private schools has shifted our education system from an in-person to a learn-from-home model that is unfamiliar to most.
Digital divide, digital equity and digital inequality issues continue to make headlines. But even with heightened discussion, there is little agreement on what should be done to improve the current state of broadband access.
There is much unknown in the era of COVID-19. School systems can only announce dates they hope to reopen. In the midst of this uncertainty we must question if administrators have any idea about the true impact this will have on students and their ability to advance to the next grade.
The youngest children are in critical phases as they learn reading and writing, basic math, and how to solve problems. Schools also provide an environment for expressing creativity and teaching basic social skills.
On the other end of the K through 12 system, teens are studying for the ACT and SAT entrance exams. Missed lessons mean wrong answers on these tests, perhaps influencing their options and choices for college. The actions – and inaction – of today could have massive impact for the future.
Lack of access to broadband Internet does not just impact education. It also has negative effects on the ability to provide public safety and emergency response; it limits opportunities for job seekers to apply for employment; it restricts access to government services and more. But the biggest impact during this crisis may be on what has been called the “homework gap.”
Quantifying the Challenge
Richard Carranza, head of New York City’s public schools said, in an interview on CBS, that “some 300,000 kids don’t have electronic devices or Internet access at home.” The city is ordering laptops from Apple and handing out WiFi hotspots to help those households that are lacking the basic equipment to get on-line. But the next questions will be: is broadband connectivity there to begin with, and will it be fast enough to support a video connection?
A 2019 Pew Research Center article focused on this very issue. At the time of their survey, only 54% of adults with annual incomes less than $30,000 had a desktop or laptop computer. Only 56% of those same low-income adults had home broadband. Tablet ownership was even lower at 34%.
Smartphone ownership was higher within this group at 71%. But the most challenging aspect of that statistic is that 26% of adults in those low-income households relied solely on their smartphone for Internet access. The Pew study also showed this to be an increase from 12% in 2013 and 20% in 2016, indicating a trend toward more “smartphone-dependent” Internet users. One result is that “reliance on smartphones also means that the less affluent are more likely to use them for tasks traditionally reserved for larger screens.”
Quantifying Connectivity
It is common for people to judge their wireless connection by looking at how many bars are shown in the upper portion of the screen on their mobile device. Those bars represent signal strength. This concept has been the focus of numerous advertising campaigns so that perception should be no surprise.
Figure 1 – Verizon Wireless Signal Strength: Harlem and South Bronx, NY
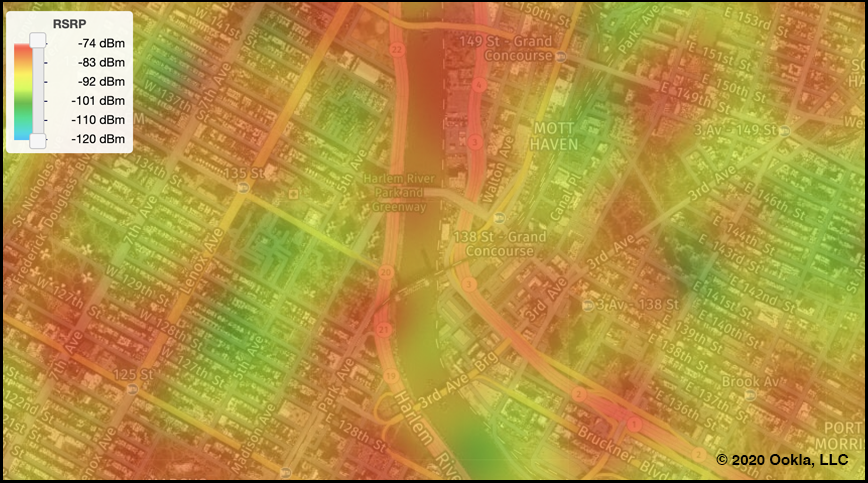
Signal strength for Verizon Wireless, represented in the image above for portions of Harlem and South Bronx, NY, is an important indicator of network availability. The red areas indicate a very strong signal, yellow to green would be fair signal strength and blue represents poor signal strength. Areas with no (by the way dBm stands for decibel-milliwatts but there is no need for the average user to know that).
Signal strength is just one metric when it comes to connectivity. A strong signal is an important measurement but other factors are just as important and sometimes more. The number of devices attempting to access the network simultaneously and the amount of data they are transferring has a direct impact on a user’s experience. This is a function of network capacity.
Capacity describes how much data can be moved back and forth across a network at a given time. As technology moved the market from the age of voice calls to the age of data connections, network capacity has become increasingly important. Video is the biggest “data hog” so when the number of video connection requests jumps unexpectedly, the network’s capacity is challenged.
Figure 2 – AT&T Indoor Signal Quality: Harlem and South Bronx, NY
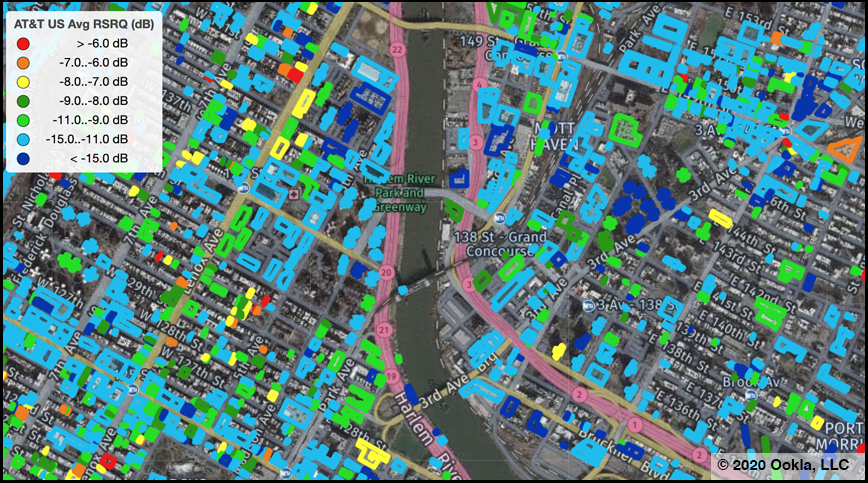
In the image above, indoor signal quality readings for AT&T’s wireless network for the same geographic area within New York City, show how difficult it is for wireless operators to penetrate buildings. Buildings shown in red have a high average signal quality. Buildings in blue have a low average signal quality. Buildings not highlighted lacked sufficient readings to categorize. (Note that these readings are from before schools were closed due to COVID-19 so many dwellings were already experiencing poor indoor service before students were sent home).
The Impact to Education
The disadvantage to children living in these households may be difficult to measure as this COVID-19 crisis is so new, but common sense would dictate that, in the absence of the opportunity to learn in a classroom, the current crisis will further hamper the education of children lacking the right tools. Add poor connectivity to this list and the opportunity to learn in a remote setting deteriorates.
During the past two decades, connecting libraries and schools has been a priority. Given the physical distancing required to combat COVID-19, those facilities are no longer available. This is forcing cities to examine new solutions to provide high-speed, reliable broadband Internet. It is simply mandatory.
If cities want to be smarter, a good place to start would be understanding which residents have access to broadband and which do not. Without this reliable data, resources cannot be efficiently allocated to the areas where the problem is most acute. Toward this end, the most important questions city leaders should be asking are associated with availability, affordability and reliability.
Real-world tests measuring network availability and performance are the most compelling empirical evidence of what people experience on their network. Some neighborhoods have been upgraded to fiber while others have not. Less affluent areas will have fewer people subscribing to the more expensive service tiers. Neighborhoods afflicted with high levels of poverty will typically rely more heavily on their wireless providers, as mentioned early in the Pew Research study.
Understanding the highest speed each network is capable of providing in a given area helps determine whether the desired level of service exists at all, regardless of how many people may actually subscribe to it. In other words, is it available? Is the existing service capable of meeting the target minimum speeds? User initiated network performance testing can answer these questions. It is also important to have enough tests to make a scientific judgment. Having only a few tests, scattered throughout the county, is statistically insignificant when trying to pinpoint neighborhoods in need.
Figure 3 – T-Mobile Download Speeds: Harlem and South Bronx, NY
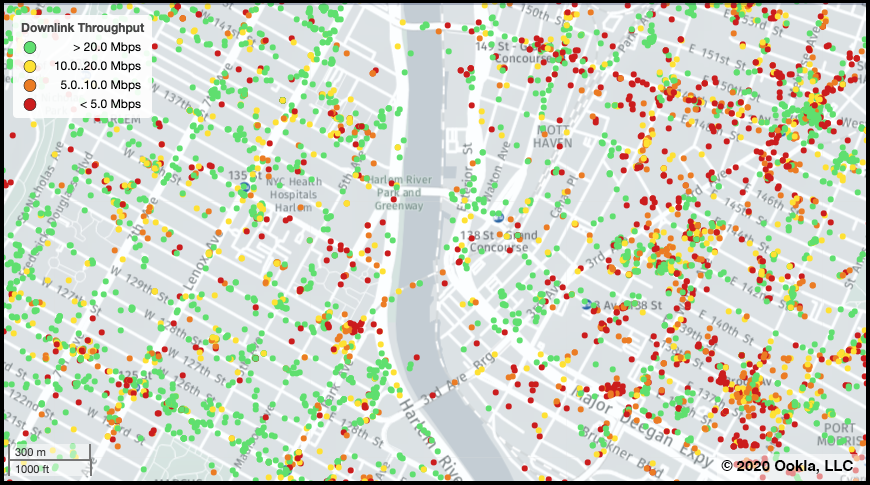
Download speeds for the T-Mobile wireless network in portions of Harlem and the South Bronx indicate that access to high quality video can be challenging for some users. Red dots represent tests with download speeds below 5Mbs, insufficient for the highest quality video streaming. This will be most common during periods of network congestion.
A Few Things to Note
It should be noted that there is no intention to highlight the challenges of any specific network. All major telecoms are mentioned to indicate that these challenges are faced by all providers. All operators have areas of their networks that are challenged due to increases in network traffic, environmental factors, etc. This is a community challenge and the solution involves both the public and the private sector.
This article focuses on the technical aspects of Internet service and purposefully does not address the complex web of related socioeconomic issues. For example, affordability is a key component related to access. There are federal programs and private sector offerings that provide financial or reduced-cost services for wireless service and fixed broadband for those below the poverty line. There is also substantial research and information related to how connectivity is but one of the pillars to bridge the Digital Divide. Hardware (computer equipment), digital skills building and a successful environment to implement digital literacy are all critical factors. This is a different topic, and for the purposes of this article, the focus is on connectivity.
Next Steps
It is imperative that city leaders work across traditional boundaries to collaborate with private sector providers and focus on solutions that can deploy connectivity and quickly. Many times connectivity is mired in bureaucracy and arduous permitting processes. It is time to be smarter and act swiftly.
The reliability of broadband services in specific areas must be accurately measured and reported. Lost connections and speeds slower than advertised are common complaints. Good data can provide intelligence to city leaders when approached by wireless companies requesting permits to place new network-enhancing infrastructure. This information can also assist local officials when negotiating the next franchise agreement for fixed operators.
While much is still unknown, offloading wireless traffic to fixed networks, often via WiFi, will help alleviate strain. The densification of wireless networks is already underway with the placement of small cells in dense urban areas. This work needs to continue. Long term, more spectrum is being brought to market by the Federal Communications Commission (FCC) for additional capacity. In the spirit of cooperation during this crisis, Dish Networks has lent some of it’s currently unused 600 MHz spectrum to the national operators to help expand their ability to handle the increase in data volume.
One day, hopefully very soon, students will return to school and perhaps lives will return to a new normal. People can return to their libraries and coffee shops to hook into WiFi. But it should be noted that while the health crisis is temporary, the digital divide is not. The homework gap may lessen again, but it will not disappear. On-line learning will continue to grow as an important part of the educational experience for all students.
It is time to build upon this unfortunate set of events related to COVID-19 and ensure that communities use solid data to set priorities for the broadband future and work quickly and collaboratively to build more network capacity.
About Bryan Darr, EVP, Smart Cities at Ookla
Bryan Darr is EVP, Smart Cities at Ookla where he focuses on telecom infrastructure and how data can make cities smarter. Previously, he was the founder of Mosaik Solutions which was acquired by Ookla in 2018. Understanding network availability and performance is at the heart of Ookla’s offering. The Speedtest app is used an average of ten million times a day to measure both fixed and wireless networks by people all over the world. Ookla is able to help local governments better understand the networks that serve specific jurisdictions and improve the intelligence available for making decisions that impact communities. (Note: The data referenced in this article is gathered from millions of Speedtest users who have opted-in to anonymously share network performance data and device experience for the networks to which they subscribe.)